In the statistics section of your campaign, you’ll find the “Results” window where you’ll be able to access the general answers of your users. Question by question you’ll be able to analyze your campaign in detail.

Because each type of question is different, each one will have a different way of displaying their results. Below, you can see examples of information that you can find in the results of your campaigns.
This type of question is the most commonly used in all forms. In the results section, you’ll find the number of answers obtained for that question with the different answer options, the number of responses each answer had and that number equivalent in a percentage.
All of this will be shown in a visual presentation where you can rapidly see the results.

Short Answer and Form
The results in these two types of questions are displayed in the same way, given that both include blank text spaces where the user can write their answers. Here you’ll find all the answers one underneath each other, in this case, you can see the name of every user given that it’s a campaign that has demographic data. Otherwise, If it doesn't have this data, the name of the respondent will not be visible.
On the top-right part, you’ll find a cloud icon and by clicking on it, the tool will recognize the most frequently used words and which are repeated in the answers. They’ll be represented as a cloud of words as shown in the following image.
Scoring
The statistics for this type of question are extremely simple. The results will be seen in the selected scale, in amount and in the icon used, and you’ll be able to see the average score selected by your users.

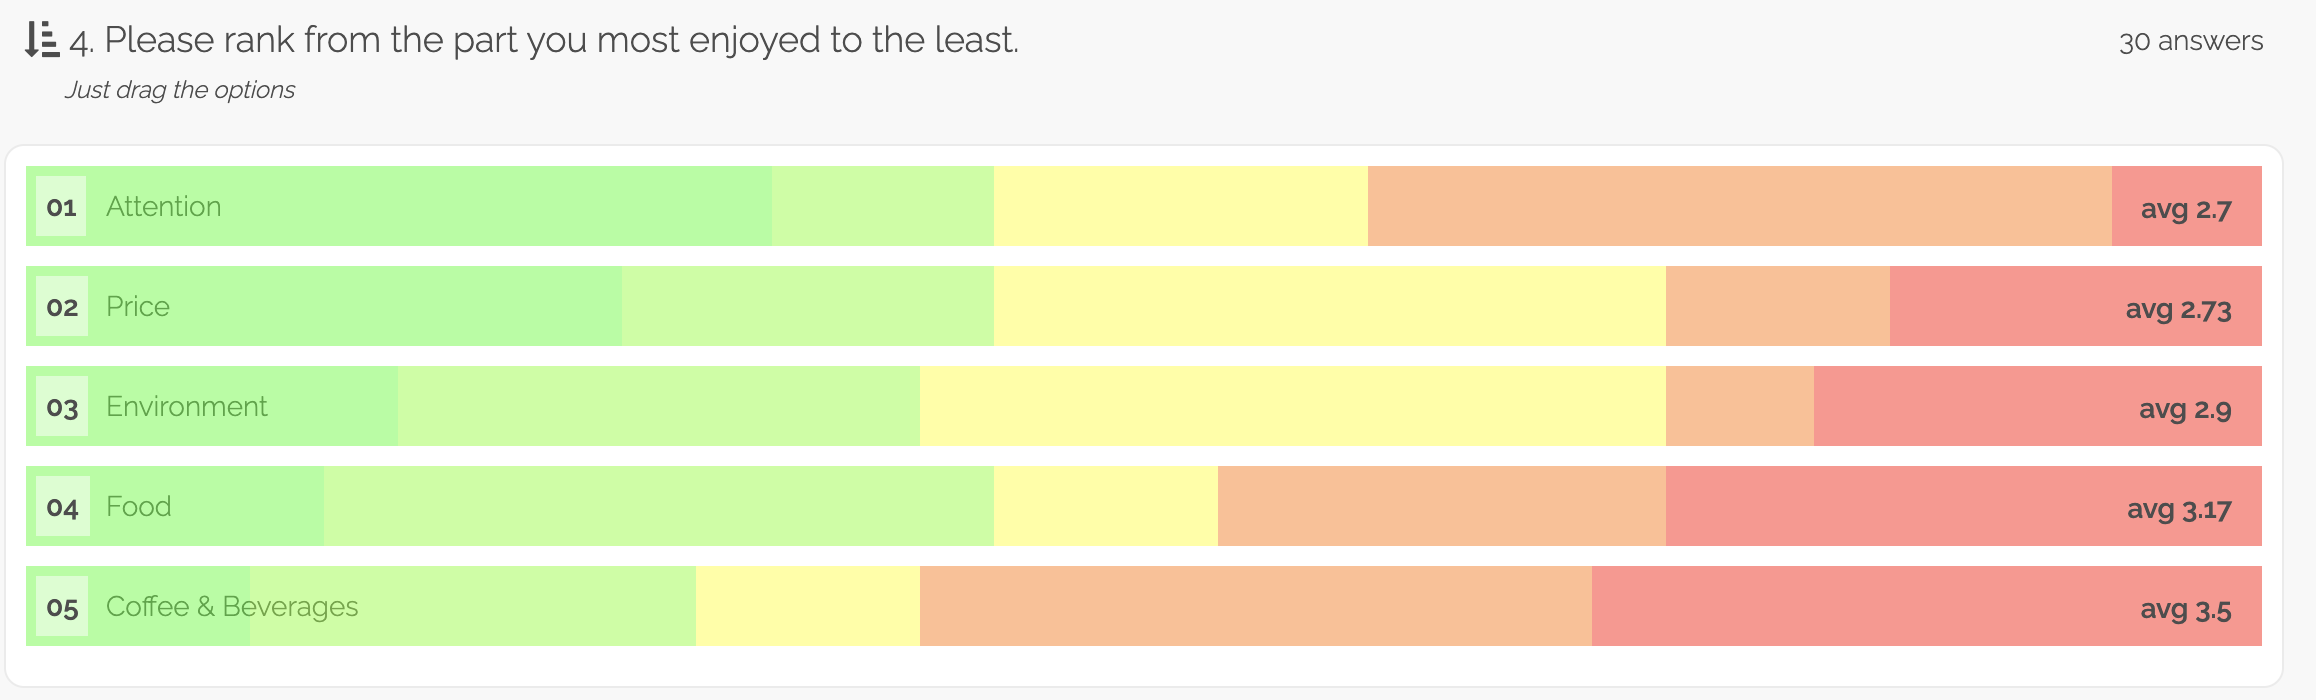
The results of this type of questions are more visual and colorful. You’ll find the different possible answers positioned according to average.
For example, in the following image, it can be seen how the “Attention” option is the most important one for your users with an average position of 2.7 followed by "Price" in an average position of 2.73.
In the same way, the colors show in a graphic way the number of times the option was positioned in first place, second place, etc.
You’ll find the same number of colors as options for your answer.
This type of question is known for having a specific calculation that generates the “Net Promoter Score” of a company, brand, product or service.
In the statistics, you’ll find the following chart where you’ll rapidly see the number of responses obtained for each one of the options through bars or columns, the Net Promoter Score and the average for the detractors and promoters.

File Upload
The questions that allow your users to upload documents will look like this in your statistics. You’ll find the user’s name and then the file name that has been uploaded. By clicking the document, a window will pop up where you’ll be able to see the document or the image separately
At the bottom of the screen, you’ll have the option to export these results by clicking on the Print Button. You’ll be able to print or export the files as PDF from the same place.